Measures of Dispersion or Variation

Measures of Dispersion or Variation
Along with measures of central tendency it is important to know something of the variability of the observations.
The most commonly used measures of variations are:
Range is the difference between the highest and lowest values.
$$Range = x_{max} - x_{min}$$
One of the weaknesses of using the range as a measure of variation is that it relies on only two values.
In addition, the range can depend on the size of the population or sample. Generally, you get a larger range for larger populations because there is a greater chance of extreme values.
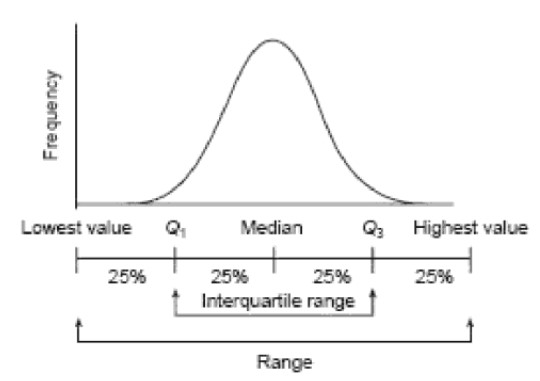
One way round the problem of relying on just two values for the range is to calculate the interquartile range.
Interquartile range (IQR) is the value for the lower quartile subtracted from the value for the upper quartile
$$IQR = upper quartile (Q_3) - lower quartile (Q_1)$$
The below exhibit summarizes two measures of spread in a symmetrical distribution. Whereas the range relies on the values of the highest and lowest values, the IQR ignores the values of the highest 25% and the lowest 25% of cases.

The range and the IQR are based on the position of the observations, not on their actual values. If we want to assess the spread of a variable in a way which takes into account all the observations, we need to use the actual values of the data and consider how they are distributed around the average value. We need to know how far each mark is above or below the mean values. A measure of variation that does consider the values of each observation is the variance.
Variance is a measure of the spread of data around a central point. It is described by the following equation
$$Variance = \frac{\sum (x_i - \overline{x})^2 }{n-1}$$
Standard Deviation is the square root of the sum of the squared deviations from the mean divided by the number of cases. For a sample, the denominator is the number of cases minus one. The formula for the standard deviation for a sample is
$$ s = \sqrt{ \frac{\sum {(x_i - \overline{x})^2} }{n-1} } $$
For the standard deviation can be used the next formula also
$$ s = \sqrt{ \frac{n\sum {x_i^2} - (\sum {x_i})^2 }{n(n-1)} } $$
If we have a frequency distribution, then the formula is
$$ s = \sqrt{ \frac{n\sum {n_ix_i^2} - (\sum {n_ix_i})^2 }{n(n-1)} } $$
The larger the standard deviation the more spread out are the data. Conversely, the smaller the standard deviation, the less spread out and the more similar are the data. A standard deviation of zero occurs when all scores are the same and there is no deviation around the mean.
Coefficient of Variation measures variability in relation to the mean and is a method by which we can compare the relative dispersion in one type of data with the relative dispersion in another type of data. The formula is
$$ C.V. = \frac{Standard Deviation}{Mean} * 100 $$
or
$$ C.V. = \frac{s}{\overline{x}} * 100 $$
Observations:
- The average deviation is not commonly used for two reasons: (i) it does not have algebraic properties; (ii) the theory of statistical inference is based on the standard deviation.
- The mean and the standard deviation of the grouped data are calculated using the same formula as for a frequency distribution. An assumption is made that the observations in each class of the frequency distribution are all located at the mid-point of the class. Therefore, x_i is equal to the midpoint of the i-th class.
- dfd
There are also other measures of dispersion, such as:
The Average Deviation from the Median (AD) is the sum of the absolute values (disregard sign) of the deviations of the individual measurements from the median divided by the number of observations.
$$AD = \frac{| \sum x_i - median |}{n}$$
Usually, the absolute deviations from the median is used as a measure of dispersion in case when the median is used as the only measure of the central tendency.
Another measure of dispersion is the median absolute deviation (MAD) calculated as
$$MAD = median{| x_i - x_{median} |}$$
Coefficient of dispersion (C.D.) is the average absolute deviation from the median normed by dividing through by the median
$$C.D. = \sum {\frac{|x_i - x_{median}|}{n*x_{median}}}$$
Gini's Mean Difference is the mean of the absolute values of the differences between all pair of values
$$ g = \frac{\sum |{x_i - x_j}|}{n(n-1) }, i \ne j $$

